Case Study on the Quality Assurance of Insulin Production using DrugLog®
Solutions to key quality control processes to assure the highest standards of accuracy and cost- effectiveness. An implementation of UV/Vis spectroscopy methodology at Queen’s Hospital, London.
INTRODUCTION
The highest quality standards are expected from pharmacists who must quickly and accurately produce ‘specials’ or compounded medications in a costeffective way. Expectations of rapid turnaround, challenges with small batch production and the production of specific, customized formulations, all increase risk of error which can have severe consequences on patients. Patient safety is dependent upon highly trained staff required to consistently meet standards of excellence. In addition, hospital pharmacy compliance audits require rigorous data validation and documentation procedures to remain in accordance with regulatory standards. These demanding responsibilities require seamless workflow and qualitycontrolled processes; all to ensure safe, efficacious medications that meet the specific clinical needs of patients.
THE MAIN CONCERN
There are different methods for quality control none of which are infallible. These methods have different strengths, weaknesses and uses. High Performance Liquid Chromatography (HPLC) is the gold standard known for its precision and accuracy. In addition, the instruments are expensive to purchase, maintain and operate. Operators need to be highly trained and process is timely and slow. Facilities must often use offsite independent analyses which can delay time and delivery for days, delaying patient care. Additional methods such as mass spectrometry and other chromatography methods are even more complex, costly, and slow.
This in turn poses the question, what if there was a different methodology that could 1) create a result in minutes versus days and 2) replicate the same precision and accuracy as HPLC.
The resulting spectral profile is used to identify the sample and calculate the concentration
DRUGLOG AND UV/VIS ABSORPTION SPECTROSCOPY
DrugLog® is a medical device that uses UV/Vis absorption spectroscopy as a fast, simple, and inexpensive way to de- termine the Identity and concentration of a substance in a solution. In UV/Vis Absorption Spectroscopy, a light source is used to send light of multiple wavelengths through a sample solution in a cuvette and the sample in the cuvette absorbs the light at varying degrees at different wave- lengths depending on the molecule. The resulting spectral profile is used to identify the sample and calculate the concentration by comparing it to predefined reference spectra.
EVALUATION
Barking, Havering and Redbridge University Hospitals NHS Trust operates two hospitals: King George Hospital and Queen’s Hospital, located in Romsford outside of London. As an integral part of Queen’s Hospital, their onsite Pharmacy Manufacturing Unit specializes in the dispensing, manufacturing, and quality control of specials, specifically insulin production. In order to maintain the highest quality standards, Queen’s Hospital sought to develop improved quality assurance and production processes allowing for insulin to be tested more quickly and cost effectively than what HPLC allowed.
At the time the hospital pharmacy manufacturing unit was sending samples from their specials production to an independent offsite facility for HPLC testing and validation. There was a 2–3 day wait to receive sample results back which impacted the ability to turnaround batch production quickly. As a solution, DrugLog® was introduced, tried, and tested onsite in order to quality assure their insulin preparations.
MATERIALS AND METHODS
Multiple measurements of insulin production batches, verified by HPLC to be at 1 IU/ml by HPLC, were used to create a baseline of 1 IU/ml on DrugLog®. To further improve accuracy 5 batches of insulin were made with a lower concentration than 1 and 5 batches with higher concentration. These batches were measured with DrugLog® and sent off to be measured with HPLC.
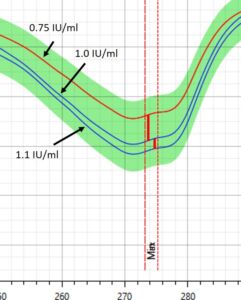
Figure 1 – Spectral profile of Insulin in DrugLog® reference spectra
During initial calibrations, it was necessary to bring DrugLog® measurement values closer to the actual HPLC values. The reference spectra for DrugLog® was slightly adjusted and the sample measurements were reanalyzed and confirmed to give virtually identical results as HPLC.
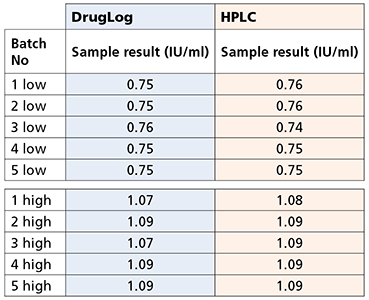
Table 1 – Results from DrugLog® and HPLC after adjustments on reference spectra of DrugLog®
Several more batches of low and high preparations were then made to confirm the new settings with good results. The resulting spectral profile for Insulin 1 IU/ml was then set and used to measure production batches.
CONCLUSION
By using this approach to adjusting the reference spectra according to HPLC data DrugLog® can deliver consistent and accurate result as compared to HPLC. When creating a narrow concentration “channel” (-25% to +10%) to the target concentration (1.0 IU/ml), DrugLog® measurements are very accurate and reproducible. Internal studies indi- cate that the reproducibility is high with a variation of less than 2% (95%,2σ) and an accuracy better than 1% (±0.9) for this kind of set up.
Queen’s hospital now regularly utilizes the DrugLog® solution to control their insulin batches as a methodology for the final step in the production process to quality assure insulin preparations.
This case study shows that the DrugLog® system can be used in biopharmaceutical production processes for quality control reducing the need for time consuming and costly HPLC analyses. With the rapid and reliable results from DrugLog® it is also conceivable, in other product processes, to not only test the end product but also test intermediate steps in a long production chain to catch errors in an early stage. This will enable the operator to correct and potentially save costs by avoiding rejection of batches.